You should first read about why I love NixOS on the server.
I really procrastinated on setting up my monitoring stack for my homelab. I mean how they heck are you supposed to have an overview of all services needed for a proper monitoring stack? There is Grafana, Prometheus, Loki, Alertmanager, promtail, node_exporter and more. Every service has its own documentation and configuration.
This is a real pain to set up and maintain. But NixOS has a great solution for this. There are existing modules for all of these services and the configuration can be done in nix. This does sound weird, but this has some big benefits:
- You have one configuration language instead 4 different ones
- You can reference the configuration of other services (Look at the Grafana config later on)
- You have an actual programming language for more advanced stuff
The biggest disadvantage is that you have to translate the example configurations into the nix equivalent.
So let’s get into how I use this setup to monitor my homelab.
Metrics
So first of you need something that collects metrics for this I use node_exporter and cAdvisor. These services all expose the current metrics at an /metrics endpoint.
node_exporter
This is a service that fetches metrics from the node via different collectors. For our use case we use the default collectors and the systemd collector.
cAdvisor
This fetches data (CPU, RAM etc.) from cgroups, most commonly docker containers. But this can also get data on systemd services because there are cgroup based as well.
For cAdvisor to also monitor non docker workloads (systemd services) you need to set an extra option: --docker_only=false.
Prometheus
Prometheus is the service that scrapes metrics from the services. It basically fetches the metrics endpoint every x seconds and stores them in a time series database.
What you need to define in the prometheus config is all the targets you want to scrape.
Here is the config for the exporters and prometheus itself:
{config, ...}: {
  services.cadvisor = {
    enable = true;
    port = 3022;
    extraOptions = ["--docker_only=false"];
  };

  services.prometheus = {
    enable = true;
    listenAddress = "127.0.0.1";
    port = 3020;
    webExternalUrl = "/prometheus/";
    checkConfig = true;

    exporters = {
      node = {
        enable = true;
        port = 3021;
        enabledCollectors = ["systemd"];
      };
    };

    scrapeConfigs = [
      {
        job_name = "node_exporter";
        static_configs = [
          {
            targets = [
              "127.0.0.1:${toString config.services.prometheus.exporters.node.port}"
            ];
          }
        ];
      }
      {
        job_name = "cadvisor";
        static_configs = [
          {
            targets = [
              "127.0.0.1:${toString config.services.cadvisor.port}"
            ];
          }
        ];
      }
    ];
  };
}
Tip
Notice the use of the actual config value (
config.services.prometheus.exporters.node.port) of the node_exporter. Isn’t that awesome? If I would change the port of node_exporter it would update it in the targets as well!
Info
I use nginx to proxy the traffic to the services, that is why the
listenAddressis127.0.0.1. If you want to access the port directly you’d have to use0.0.0.0.I will also show the nginx config at the end.
The
webExternalUrlis for Prometheus and Grafana being on the same hostname in the nginx. If you don’t want that just remove the line.
Logs
Loki
Loki is a datastore made by Grafana to store logs and query them.
{...}: {
  services.loki = {
    enable = true;
    configuration = {
      server.http_listen_port = 3030;
      auth_enabled = false;

      common = {
        replication_factor = 1;
        path_prefix = "/tmp/loki";
        ring = {
          kvstore.store = "inmemory";
          instance_addr = "127.0.0.1";
        };
      };

      schema_config = {
        configs = [{
          from = "2020-05-15";
          store = "tsdb";
          object_store = "filesystem";
          schema = "v13";
          index = {
            prefix = "index_";
            period = "24h";
          };
        }];
      };

      storage_config.filesystem.directory = "/tmp/loki/chunks";

      analytics.reporting_enabled = false;
    };
  };
}
promtail
We now have Loki but we also need something that pushes those logs into Loki. This is what promtail is for.
Promtail needs to have file permissions to read the log files. So for the nginx logs you have to give the promtail user the proper group.
{config, ...}: {
  # permissions
  users.groups.promtail = {};
  users.groups.nginx = {};
  users.users.promtail = {
    isSystemUser = true;
    group = "promtail";
    extraGroups = ["nginx"];
  };

  services.promtail = {
    enable = true;
    configuration = {
      server = {
        http_listen_port = 3031;
        grpc_listen_port = 0;
      };
      positions = {
        filename = "/tmp/positions.yaml";
      };
      clients = [
        {
          url = "http://127.0.0.1:${toString config.services.loki.configuration.server.http_listen_port}/loki/api/v1/push";
        }
      ];
      scrape_configs = [
		# For systemd logs
        {
          job_name = "journal";
          journal = {
            max_age = "12h";
            labels = {
              job = "systemd-journal";
              host = "your_hostname";
              instance = "127.0.0.1";
            };
          };
          relabel_configs = [
            {
              source_labels = ["__journal__systemd_unit"];
              target_label = "unit";
            }
          ];
        }
		# For nginx logs
        {
          job_name = "nginx";
          static_configs = [
            {
              targets = ["127.0.0.1"];
              labels = {
                job = "nginx";
                __path__ = "/var/log/nginx/*.log";
                host = "your_hostname";
                instance = "127.0.0.1";
              };
            }
          ];
        }
      ];
    };
  };
}
Alerting
Now we still have a thing to do before we can look at our metrics. We want to get notified when something doesn’t go as expected. For this Prometheus has the Alertmanager.
Warning
In my config I use SMTP for sending alerts. For this you need a password, and you shouldn’t just put your secrets as plain text into the nix configs. Please use something like sops-nix. This takes a while to set up and wrap your head around but is necessary to have a secure config.
I will probably write a post about this in the future.I did write something about it here.
But nonetheless here is my config:
{config, ...}: {
users.groups.alertmanager = {};
  users.users.alertmanager = {
    isSystemUser = true;
    group = "alertmanager";
    extraGroups = ["smtp"];
  };

  services.prometheus = {
    alertmanager = {
      enable = true;
      port = 3023;
      checkConfig = true;
      configuration = {
        global = {
          smtp_smarthost = "smtp.resend.com:587";
          smtp_from = "[email protected]";
          smtp_auth_username = "resend";
          smtp_auth_password_file = config.sops.secrets.resendApiKey.path;
        };

        route = {
          group_by = ["alertname"];
          group_wait = "30s";
          group_interval = "5m";
          repeat_interval = "3h";
          receiver = "me";
          routes = [
            {
              match = {
                severity = "critical";
              };
              receiver = "me";
            }
          ];
        };

        receivers = [
          {
            name = "me";
            email_configs = [
              {
                send_resolved = true;
                to = "[email protected]";
              }
            ];
          }
        ];
      };
    };

    alertmanagers = [
      {
        scheme = "http";
        static_configs = [
          {
            targets = ["127.0.0.1:${toString config.services.prometheus.alertmanager.port}"];
          }
        ];
      }
    ];

    rules = [
      /*
      yaml
      */
      ''
        groups:
          - name: alertmanager
            rules:
              - alert: InstanceDown
                expr: up == 0
                for: 1m
                labels:
                  severity: critical
                annotations:
                  summary: "Instance {{ $labels.instance }} down"
                  description: "{{ $labels.instance }} of job {{ $labels.job }} has been down for more than 1 minute."
              # Please add ignored mountpoints in node_exporter parameters like
              # "--collector.filesystem.ignored-mount-points=^/(sys|proc|dev|run)($|/)".
              # Same rule using "node_filesystem_free_bytes" will fire when disk fills for non-root users.
              - alert: HostOutOfDiskSpace
                expr: ((node_filesystem_avail_bytes * 100) / node_filesystem_size_bytes < 10 and ON (instance, device, mountpoint) node_filesystem_readonly == 0) * on(instance) group_left (nodename) node_uname_info{nodename=~".+"}
                for: 2m
                labels:
                  severity: critical
                annotations:
                  summary: Host out of disk space (instance {{ $labels.instance }})
                  description: "Disk is almost full (< 10% left)\n  VALUE = {{ $value }}\n  LABELS = {{ $labels }}"
              - alert: HostOutOfMemory
                expr: (node_memory_MemAvailable_bytes / node_memory_MemTotal_bytes * 100 < 10) * on(instance) group_left (nodename) node_uname_info{nodename=~".+"}
                for: 2m
                labels:
                  severity: critical
                annotations:
                  summary: Host out of memory (instance {{ $labels.instance }})
                  description: "Node memory is filling up (< 10% left)\n  VALUE = {{ $value }}\n  LABELS = {{ $labels }}"
              - alert: HostSystemdServiceCrashed
                expr: (node_systemd_unit_state{state="failed"} == 1) * on(instance) group_left (nodename) node_uname_info{nodename=~".+"}
                for: 0m
                labels:
                  severity: warning
                annotations:
                  summary: Host systemd service crashed (instance {{ $labels.instance }})
                  description: "systemd service crashed\n  VALUE = {{ $value }}\n  LABELS = {{ $labels }}"
      ''
    ];
  };
}
Tip
To get nice alerts without fidgeting with the rules yourself I can recommend Awesome Prometheus alerts
Visualize
Grafana
The final step is too actual see something. For that you use Grafana. This is a tool for creating dashboards for various data sources. In our case Prometheus and Loki.
Info
You create dashboards in the UI but for recovery and version management sake you should also have them in a Git repo. The workflow here is to start with and empty
dashboardsfolder. Try out some of the dashboards and then put the ones you want to keep, or you created yourself into dashboards folder as a JSON. To do this just click on share and then export in the Grafana UI.
{config, ...}: {
  # this puts the folder dashboards on the host system at /etc/grafana/dashboards
  environment.etc."grafana/dashboards" = {
    source = ./dashboards;
    user = "grafana";
    group = "grafana";
  };

  services.grafana = {
    enable = true;

    settings = {
      server = {
        http_addr = "127.0.0.1";
        http_port = 3010;
      };

      analytics = {
        reporting_enabled = false;
        feedback_links_enabled = false;
      };
    };


    provision = {
      enable = true;
      dashboards.settings.providers = [
        {
          # this tells grafana to look at the path for dashboards
          options.path = "/etc/grafana/dashboards";
        }
      ];
      datasources.settings.datasources = [
        {
          name = "Prometheus";
          type = "prometheus";
          access = "proxy";
          url = "http://127.0.0.1:${toString config.services.prometheus.port}/prometheus";
        }
        {
          name = "Loki";
          type = "loki";
          access = "proxy";
          url = "http://127.0.0.1:${toString config.services.loki.configuration.server.http_listen_port}";
        }
      ];
    };
  };
}
Now you also need to import Dashboards into Grafana. For this I can recommend the following:
- Node Exporter Full ID:
1860 - Cadvisor exporter ID:
14282 - My own systemd dashboard (The Grafana site to upload dashboards doesn’t work right now)
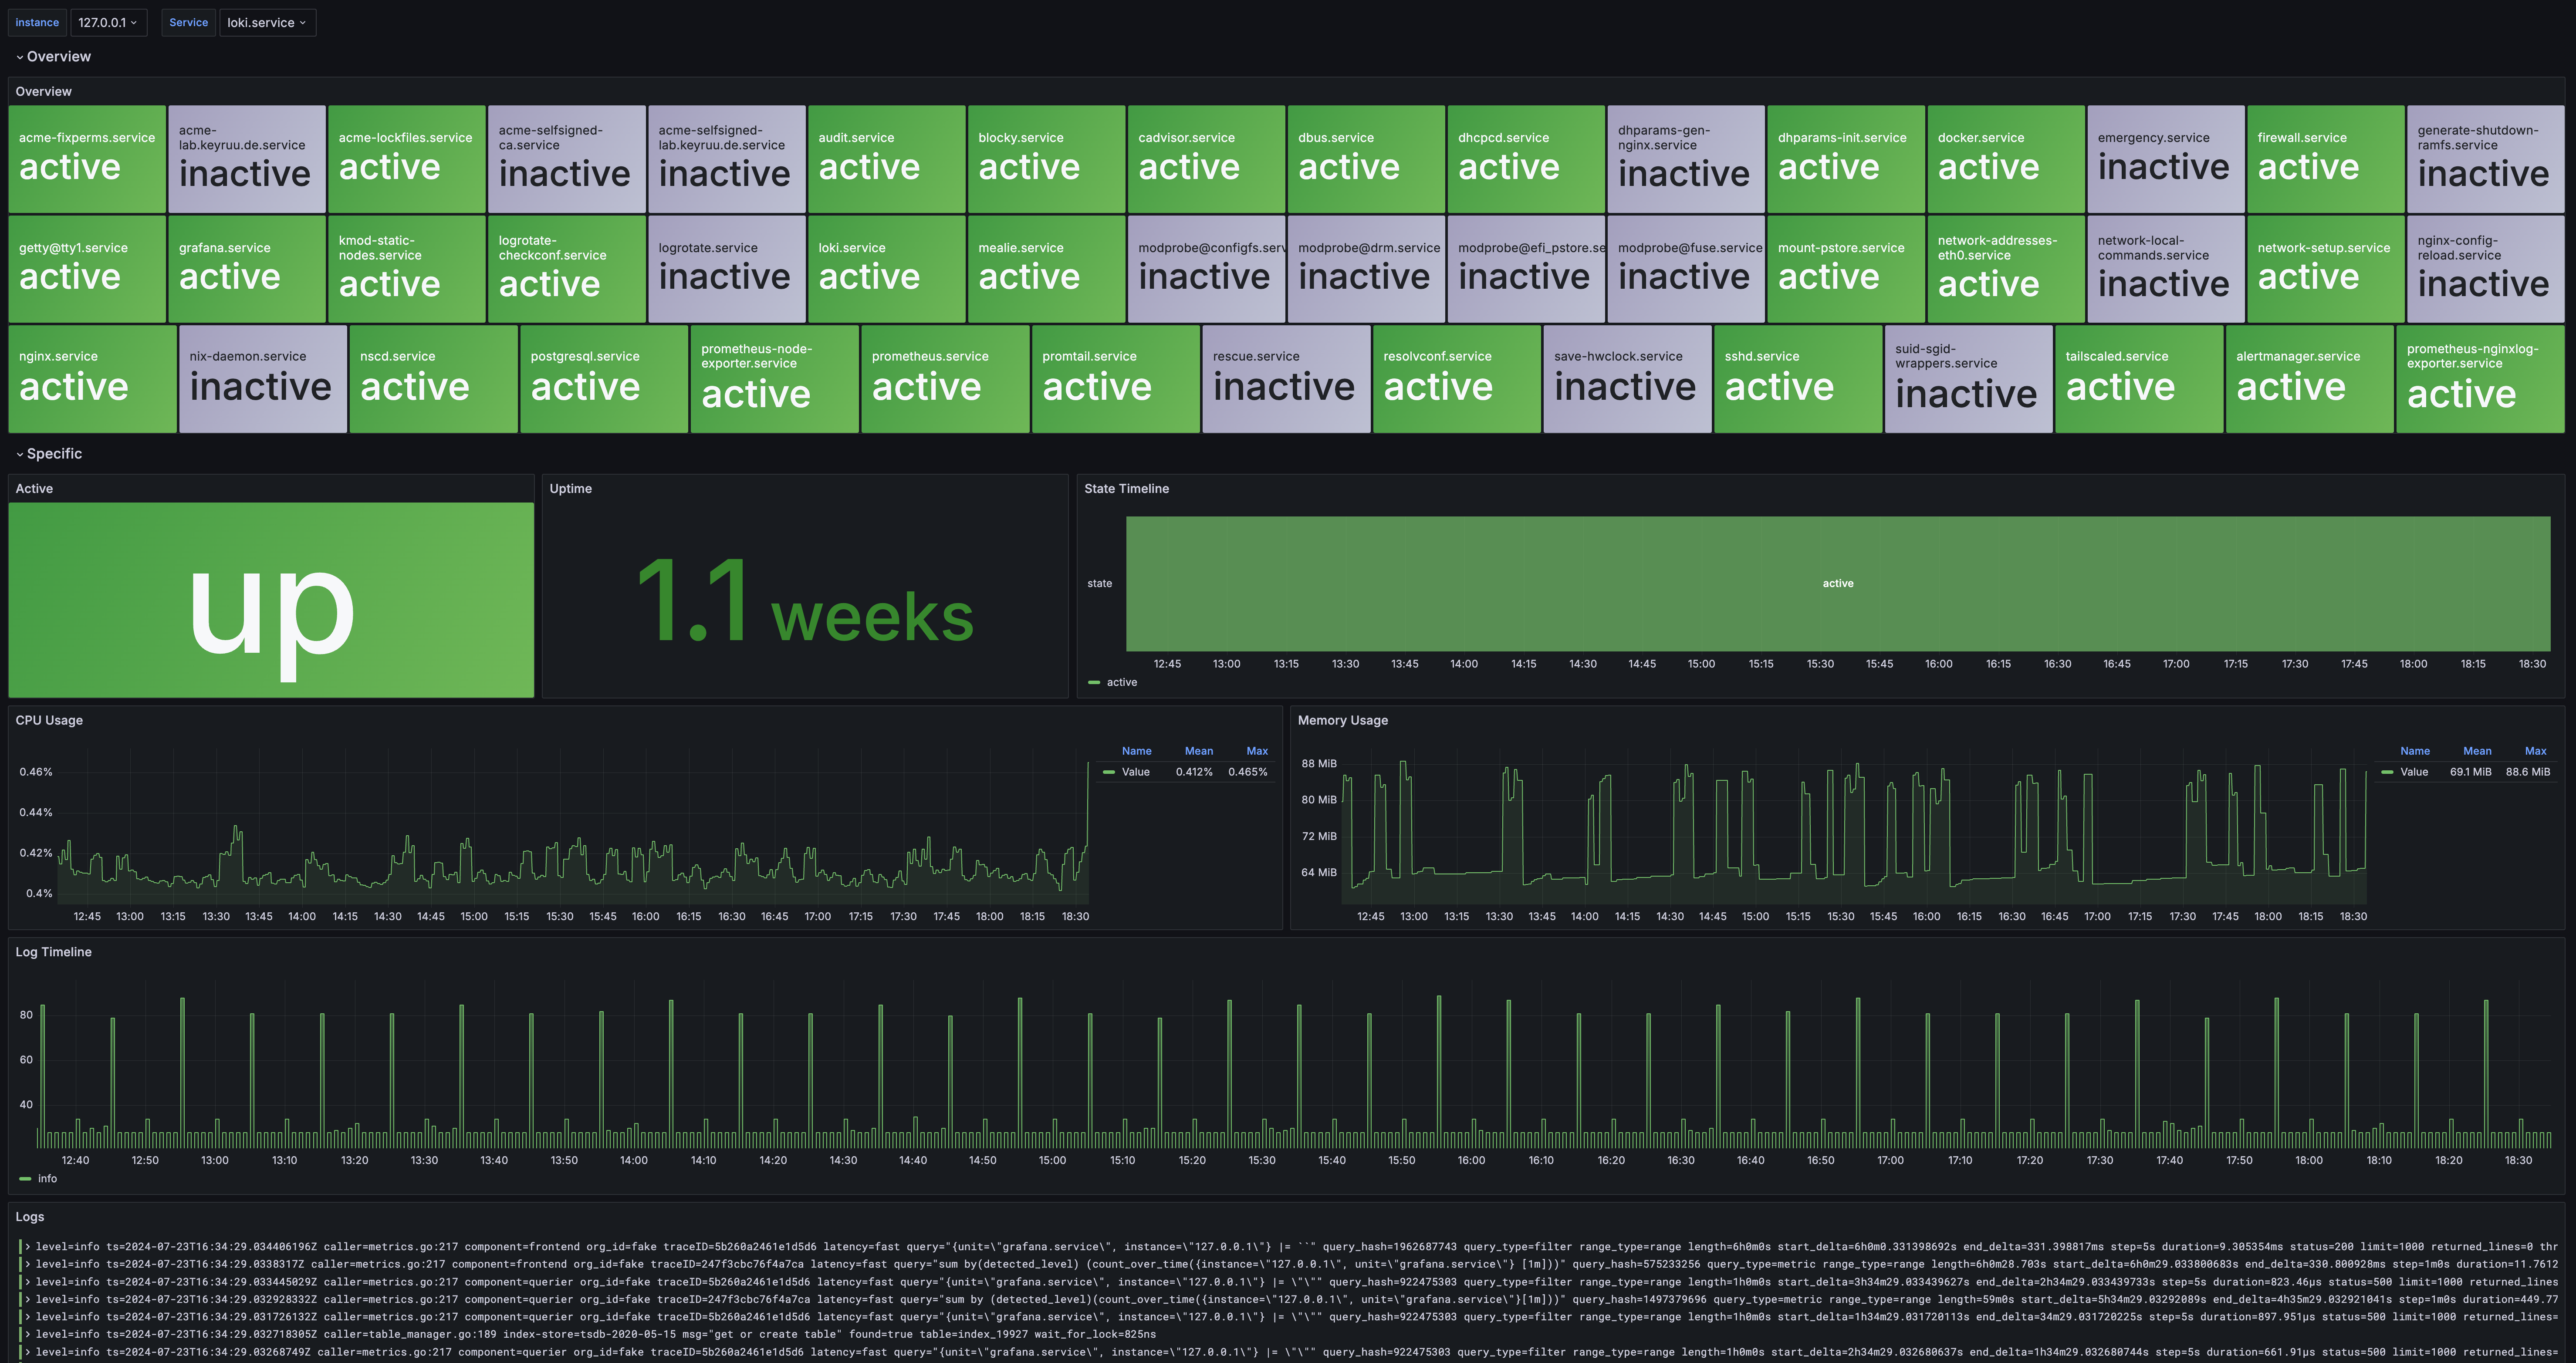 (Isn’t that dashboard awesome? It took quite a bit to have everything like that)
With this we basically have everything we need for the base of our monitoring services. But I mentioned that I use nginx to proxy the requests for Grafana and Prometheus.
(Optional) NGINX / Proxy
I won’t go into great detail how the nginx config works, I do want to have it in this guide for completeness’ sake. I will probably do a post in the future that describes this setup in more detail.
{config, ...}: {
  security.acme = {
    acceptTerms = true;
    defaults.email = "[email protected]";
  };

  security.dhparams = {
    enable = true;
    params.nginx = {};
  };

  services.nginx = {
    enable = true;
    recommendedGzipSettings = true;
    recommendedOptimisation = true;
    recommendedProxySettings = true;
    recommendedTlsSettings = true;
    resolver.addresses = config.networking.nameservers;
    sslDhparam = config.security.dhparams.params.nginx.path;
  };

  networking.firewall.allowedTCPPorts = [ 80 443 ];

  users.users.nginx.extraGroups = [ "acme" ];

  security.acme = {
      certs."lab.example.com" = {
        domain = "lab.example.com";
        extraDomainNames = [ "*.lab.example.com" ];
        dnsProvider = "cloudflare";
        dnsPropagationCheck = true;
        credentialsFile = config.sops.secrets.cloudflare.path;
	  };
    };
  };

  services.nginx.virtualHosts."monitoring.example.com" = {
    useACMEHost = "lab.example.com";
    forceSSL = true;
    locations."/prometheus/" = {
      proxyPass = "http://127.0.0.1:${toString config.services.prometheus.port}";
    };

    locations."/" = {
      proxyPass = "http://127.0.0.1:${toString config.services.grafana.settings.server.http_port}";
      proxyWebsockets = true;
    };
  };
}
Warning
If you don’t know what
sops,acmeand all the other settings mean you probably shouldn’t use this config :D
Closing remarks
This is a base setup. You should adjust all the snippets however you like and add as much stuff as you want to. A monitoring setup is never really done, but I think I’m at a pretty good point with mine. To see the current configuration I have you can look at my shinyflakes repo on GitHub.